



The Architecture of Linux Performance Monitoring and Optimization
Introduction to the Linux Performance Landscape
Linux powers a vast majority of the world’s enterprise servers, cloud infrastructure, containerized environments, and high-performance computing clusters. Because of its ubiquity and deep integration into modern architecture, understanding how to monitor and tune a Linux system is a critical competency for system administrators, site reliability engineers, and infrastructure architects. When a system slows down or encounters resource contention, diagnosing the root cause requires a systematic approach that looks past superficial symptoms to examine core subsystems. Performance tuning is not a one-time configuration task; it is an ongoing cycle of measurement, analysis, adjustment, and verification. To master this cycle, professionals must understand how the Linux kernel interacts with hardware components, how processes consume resources, and which tools provide the most accurate telemetry without introducing excessive overhead of their own.
The Four Pillars of System Resources
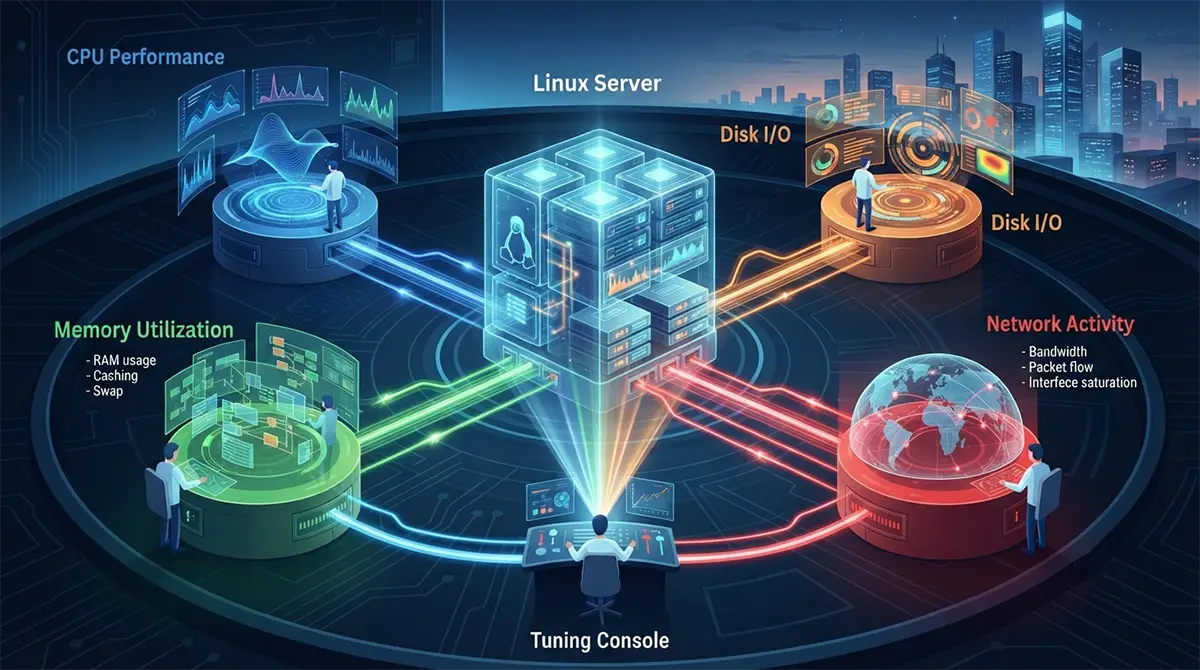
Every performance issue on a Linux system ultimately manifests as a bottleneck in one of four primary hardware resource categories: CPU, memory, disk I/O, or network. Understanding these resources individually and how they interact with each other forms the foundation of effective troubleshooting.
-
Central Processing Unit (CPU): The processing engine handles computations, thread execution, and instruction processing. Bottlenecks here are often characterized by high load averages, high context-switching rates, or processes stuck in a waiting state.
-
Random Access Memory (RAM): Memory management dictates how fast applications can access working data. When physical RAM is exhausted, the system relies on swap space, which can drastically reduce performance due to disk latency.
-
Disk Input/Output (Storage): Storage subsystems handle persistent data reads and writes. High latency in this layer causes application threads to block while waiting for data persistence or retrieval.
-
Network Subsystem: Network interfaces manage incoming and outgoing data packets. Packet drops, interface saturation, and high latency can cripple distributed applications and microservices.
Deep Dive into Core Subsystems and Metrics
Unraveling CPU Performance and Utilization
The CPU subsystem is frequently the first place administrators look when a system experiences sluggishness, but CPU metrics can easily be misinterpreted. The load average, traditionally displayed by commands like uptime or top, represents the number of processes in the run queue or waiting for uninterruptible disk I/O over one, five, and fifteen-minute intervals. However, a high load average does not automatically mean the CPU is overloaded; it can also indicate heavy disk I/O wait times. Inside the CPU utilization breakdown, several states demand close attention. User time represents CPU cycles spent running user-space applications. System time accounts for kernel-level operations, such as system calls and driver execution. Idle time shows available capacity, while nice time reflects processes running with altered priorities. More critically, administrators must monitor the wait time (often labeled as %wa in tools like top), which indicates how long the CPU is idle because it is waiting for an I/O request to complete. High I/O wait points directly to storage or file system bottlenecks rather than raw processing limitations. Furthermore, in virtualized environments, steal time becomes vital; it measures the percentage of time a virtual CPU waited for a physical CPU while the hypervisor serviced other virtual machines.
Memory Subsystem Dynamics and Virtual Memory
Linux memory management is sophisticated, designed to maximize RAM utilization by caching disk data in unused memory. Consequently, a system with very little “free” memory is often performing exactly as intended. The metric that truly matters is available memory, which estimates how much RAM can be allocated immediately without swapping. When physical memory fills up, the kernel invokes the out-of-memory (OOM) killer or begins paging data to swap space. Swap activity should be monitored closely using indicators like swap-in (si) and swap-out (so) rates via vmstat. Frequent swapping indicates severe memory pressure, which severely degrades application performance. Additionally, understanding page cache, buffer cache, and dirty pages helps administrators tune how aggressively the kernel writes cached data back to persistent storage.
Storage and Disk I/O Bottlenecks
Disk I/O performance is governed by throughput, input/output operations per second (IOPS), and latency. Traditional spinning hard drives and modern solid-state drives handle workloads differently, but both can become choked under heavy concurrent write operations. When analyzing storage, administrators must look beyond simple disk utilization percentages. A disk operating at 100% utilization might still have low latency if the queue depth is managed efficiently, whereas a poorly tuned queue can cause requests to pile up, leading to application timeouts. Metrics such as average request size, service time, and wait time within the request queue provide a granular view of whether the storage hardware, file system, or application access pattern is causing the slowdown.
Network Stack Performance and Troubleshooting
The Linux network stack handles everything from local loopback communication to high-throughput data center traffic. Monitoring this subsystem involves tracking packet rates, error counts, drop rates, and socket states. Interface saturation occurs when bandwidth limits are reached, resulting in discarded packets. Buffer bloat can introduce massive latency spikes as packets queue up in network interface card buffers. Monitoring tools must track soft interrupts (softirqs), which handle network packet processing at the kernel level. If a single CPU core is overwhelmed by softirqs, network performance drops significantly, requiring techniques like Receive Side Scaling (RSS) to distribute the processing load across multiple cores.
Essential Linux Monitoring Tools
Traditional Command-Line Utilities
A seasoned Linux administrator relies on a robust suite of native command-line utilities to inspect system health in real-time. These tools are ubiquitous, lightweight, and pre-installed on virtually every distribution.
-
top and htop: The quintessential real-time process viewers. While top provides a quick text-based summary of CPU, memory, and process lists, htop offers a color-coded, interactive interface with mouse support, tree-view process layouts, and easier sorting capabilities.
-
vmstat (Virtual Memory Statistics): Reports information about processes, memory, paging, block I/O, traps, and CPU activity. Running vmstat with a time interval (e.g., vmstat 2) reveals trends over time rather than a static snapshot.
-
iostat: Essential for storage performance analysis, iostat details CPU utilization alongside detailed device utilization, request rates, and throughput metrics for individual disks and partitions.
-
sar (System Activity Reporter): Part of the sysstat package, sar collects, reports, and saves system activity information over time. It is invaluable for historical analysis, allowing administrators to review performance trends from hours or days prior.
-
netstat and ss: Used for examining socket statistics, routing tables, interface statistics, and masquerade connections. The modern ss command is faster and provides deeper insight into TCP socket states than the legacy netstat.
Advanced Performance Analysis with Perf and Tracepoint Utilities
When standard monitoring tools indicate a bottleneck but cannot pinpoint the exact function or system call responsible, low-level profiling tools come into play. The perf tool, powered by the Linux kernel performance counters, allows engineers to profile CPU utilization, cache misses, branch mispredictions, and software-level events. By recording system-wide activity or targeting a specific application process, perf generates a detailed breakdown of where code execution spends the most time. For deeper kernel tracing, modern Linux systems leverage eBPF (Extended Berkeley Packet Filtering) frameworks and tools like bpftrace and BCC (BPF Compiler Collection). These tools enable safe, non-invasive tracing of kernel functions, system calls, file system operations, and network packets with minimal performance overhead. Organizations leveraging modern cloud architectures often consult specialists providing DevOps Services in Dubai to implement these advanced observability and tracing pipelines across complex Kubernetes clusters.
Performance Tuning Strategies and Kernel Optimization
Tuning Kernel Parameters via Sysctl
The Linux kernel exposes hundreds of runtime parameters through the /proc/sys virtual file system, which can be inspected and modified using the sysctl command or by writing configuration files into /etc/sysctl.d/. Tuning these parameters allows administrators to tailor the operating system behavior to specific workloads, such as high-throughput web servers or low-latency database engines.
-
Virtual Memory Tuning: Adjusting vm.swappiness controls how aggressively the kernel swaps out anonymous memory processes versus dropping page cache. Lowering swappiness keeps more application data in physical RAM, which is ideal for database servers with ample memory. Modifying vm.dirty_background_ratio and vm.dirty_ratio dictates when background processes start flushing dirty memory pages to disk, preventing sudden I/O spikes.
-
Network Stack Optimization: Network throughput and connection handling can be vastly improved by tuning TCP buffer sizes and connection tracking limits. Parameters like net.core.somaxconn increase the maximum number of queued connection requests, preventing connection refusal errors under high traffic loads. Adjusting TCP window scaling and enabling TCP BBR congestion control algorithms can dramatically improve throughput over high-latency WAN links.
Storage Subsystem and I/O Scheduler Tuning
Selecting the appropriate I/O scheduler can drastically impact storage performance, particularly when transitioning between traditional spinning hard disks and modern NVMe solid-state drives. The kernel offers several schedulers, including BFQ (Budget Fair Queueing), Kyber, and None (bypass). For enterprise-grade SSDs and NVMe drives, using the none scheduler or mq-deadline minimizes CPU overhead and leverages the inherent parallelism of the underlying storage media. Additionally, adjusting the file system mount options—such as disabling access time updates (noatime) on frequently written file systems—reduces unnecessary metadata write operations, thereby extending disk lifespan and improving write performance.
Application-Level Monitoring and Profiling
Identifying Memory Leaks and Resource Hogs
While system-level monitoring reveals overall hardware strain, application-level issues often drive that strain. Memory leaks occur when software allocates dynamic memory but fails to release it back to the operating system, causing gradual memory consumption growth until the application crashes or triggers the OOM killer. Tools like Valgrind, AddressSanitizer, and built-in runtime profilers help developers detect memory leaks during testing. In production environments, administrators can track application memory consumption using ps, top, or specialized runtime monitors tailored for languages like Python, Java, or Node.js. Identifying erratic CPU spikes often requires thread dumps or profiling tools that map CPU consumption directly back to specific functions, classes, or database query statements.
Database and Web Server Performance Tuning
Web servers like Nginx and Apache, alongside databases like PostgreSQL and MySQL, represent the core of most Linux-hosted application stacks. Tuning these services requires careful alignment with underlying Linux resource limits. For instance, increasing the maximum open file descriptors limit (nofile) via systemd service files or the /etc/security/limits.conf configuration file is essential for web servers handling thousands of simultaneous client connections. Similarly, database tuning involves optimizing buffer pools, query cache sizes, connection pooling limits, and ensuring proper index usage to minimize disk reads and maintain low query execution latencies. In competitive enterprise markets, businesses frequently collaborate with regional experts specializing in Linux dubai salary structures and talent acquisition to hire skilled systems engineers capable of maintaining these complex multi-tier database environments.
Log Analysis and Centralized Observability
Harnessing System Logs and Journald
Logs provide the historical narrative of system health, application errors, and security events. On modern Linux distributions utilizing systemd, the journalctl utility provides powerful filtering capabilities to query the system journal. Administrators can filter logs by priority level, boot session, specific service units, or kernel messages. For example, checking kernel messages with journalctl -k can instantly reveal hardware failures, driver crashes, or OOM killer interventions. Centralizing these logs is vital for enterprise environments, ensuring that log data is preserved even if a server experiences catastrophic hardware failure or unauthorized tampering.
Modern Observability Stacks and Alerting
Moving beyond reactive troubleshooting requires a comprehensive observability stack that integrates metrics collection, log aggregation, and distributed tracing. The industry standard often revolves around Prometheus for time-series metrics scraping, Grafana for visualization dashboards, and Alertmanager for routing notifications to on-call engineers. Setting up proactive alerting rules ensures that operations teams are notified of impending resource exhaustion—such as disk space reaching 85% capacity or memory usage trends predicting an OOM event within hours—long before user experience is impacted. When internal IT teams require specialized assistance with deploying, scaling, or troubleshooting these complex monitoring architectures, partnering with providers offering Best tech support dubai ensures rapid incident resolution and robust infrastructure resilience.
Real-World Troubleshooting Workflow
A Step-by-Step Methodology for Incident Response
When a production Linux server encounters an unexpected performance degradation or outage, panicking and blindly restarting services rarely solves the underlying issue. Instead, engineers should follow a structured troubleshooting methodology.
-
Step 1: Assess Global Symptoms: Begin by checking uptime, load averages, and global resource utilization via top or htop to identify which subsystem is experiencing the highest strain.
-
Step 2: Inspect Kernel and System Logs: Review recent entries in /var/log/syslog, dmesg, or journalctl to catch hardware errors, kernel panics, segmentation faults, or OOM killer activity.
-
Step 3: Analyze Subsystem Metrics: Dive deeper using specialized tools. If CPU is high, check process-level breakdowns. If I/O wait is high, use iostat to pinpoint the offending disk. If network issues are suspected, check interface drop counts and socket states with ss.
-
Step 4: Isolate the Root Cause: Correlate metric spikes with application deployment times, cron jobs, backup schedules, or external traffic surges.
-
Step 5: Apply Remediation and Document: Implement targeted fixes, such as terminating rogue processes, adjusting sysctl parameters, or scaling resources. Document the incident, the telemetry data used for diagnosis, and the remediation steps taken to prevent recurrence in future operational cycles.