


In the modern landscape of software engineering, microservices, containerization, and distributed cloud native applications have fundamentally transformed how systems are built, deployed, and maintained. With this architectural shift, the traditional methods of monitoring have become obsolete. When applications span hundreds of containers, orchestrate dynamic serverless functions, and rely on ephemeral infrastructure, knowing whether a server is simply up or down is no longer sufficient. Engineering teams require deep visibility into application performance, underlying infrastructure health, and end user experience. This requirement has given rise to the discipline of observability, transforming how developers and system administrators interact with production environments.
At the center of this observability revolution sit two dominant forces that represent contrasting philosophies in software tooling. On one side stands Prometheus, the open source titan born out of SoundCloud, nurtured by the Cloud Native Computing Foundation, and adopted as the default standard for Kubernetes monitoring. On the other side stands Datadog, the commercial Software as a Service giant that has evolved from a simple infrastructure monitoring agent into a comprehensive, unified observability and security platform. Choosing between Prometheus and Datadog is not merely a technical decision about which tool to install. It is a strategic architectural choice that impacts your engineering budget, your operational overhead, your data governance policies, and your team workflow for years to come.
Understanding the nuances of both platforms requires looking past marketing claims and examining their architectural foundations, operational models, cost structures, and practical capabilities. This comprehensive analysis will explore every facet of Prometheus and Datadog, equipping you with the knowledge needed to make an informed decision for your organization.
Understanding Prometheus: The Open Source Powerhouse
Prometheus was designed from the ground up to address the specific monitoring challenges of highly dynamic, containerized environments. Released as an open source project, Prometheus gained rapid traction due to its alignment with the Kubernetes ecosystem. At its core, Prometheus is a time series database coupled with a powerful scraping engine and a dedicated alerting toolkit.
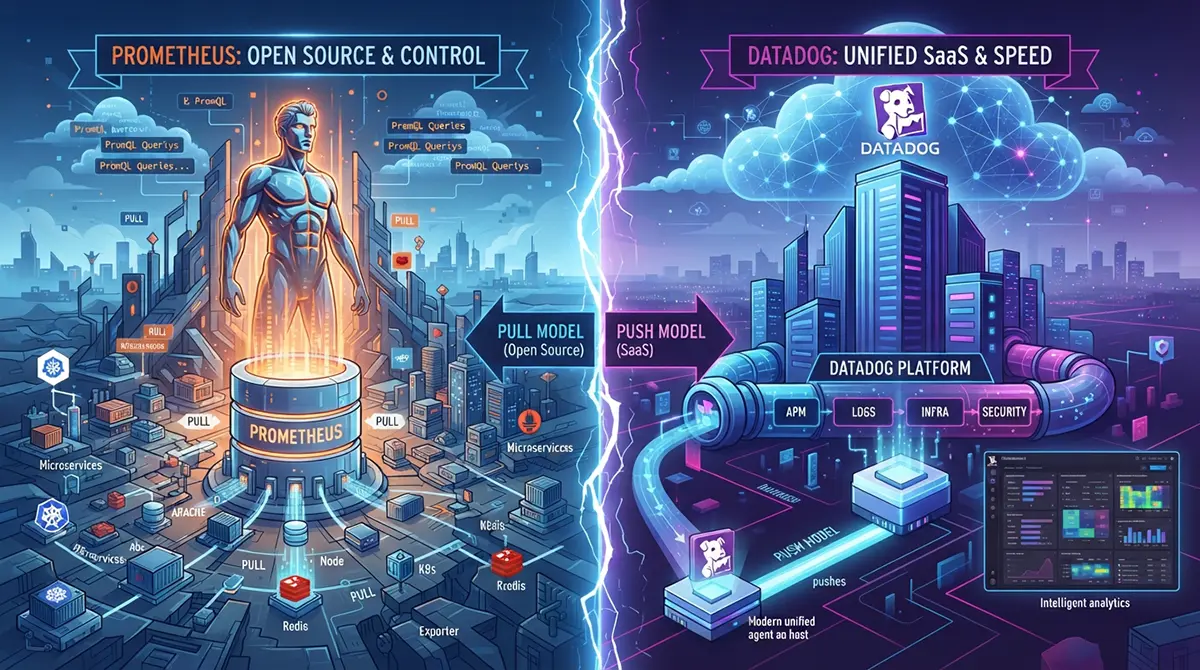
The core philosophy of Prometheus centers around simplicity, reliability, and autonomy. Instead of relying on complex distributed agents that push data to a central repository, Prometheus uses a pull based architecture. It periodically scrapes HTTP endpoints exposed by target applications, exporters, or services to collect time series metrics. This approach decouples the metrics collector from the targets, meaning if a target goes down, the Prometheus server simply records the failure rather than crashing or dropping packets due to overwhelmed ingestion pipelines.
Prometheus introduced PromQL, a functional query language designed specifically for time series data. PromQL allows engineers to slice, dice, aggregate, and compute rates on metrics in real time. This capability makes it exceptionally powerful for analyzing system behavior, defining alert conditions, and feeding custom dashboards. Furthermore, Prometheus integrates seamlessly with Grafana, the industry standard visualization tool, allowing teams to build rich, customized dashboards without being locked into a proprietary interface.
Despite its immense power, native Prometheus is designed for local instance storage. For large scale environments spanning multiple cloud regions or clusters, managing Prometheus requires additional components like Thanos or Cortex to handle long term storage and global querying. This modular nature provides incredible flexibility, but it also places the burden of architecture management squarely on the shoulders of your operations or platform engineering teams.
Need a Reliable DevOps Partner in Dubai?
Managing servers, monitoring performance, and automating workflows can be overwhelming when you’re trying to scale your business. If you’re looking for hands-on expertise in cloud migration, server hardening, and pipeline automation, We are here to bridge the gap. Reach out to us and let’s build a resilient infrastructure tailored to your needs.
Understanding Datadog: The SaaS Observability Ecosystem
Datadog takes a completely different approach to the observability challenge. Founded as a cloud scale monitoring service, Datadog has expanded into an all in one platform that covers infrastructure monitoring, application performance monitoring, log management, real user monitoring, network performance monitoring, continuous integration visibility, and cloud security posture management.
Instead of requiring you to piece together various open source tools, exporters, and databases, Datadog provides a unified agent that installs on your hosts or clusters. This agent collects metrics, traces, and logs out of the box, shipping them securely to Datadog managed cloud infrastructure. This turnkey nature means that within minutes of installing the Datadog agent, you gain access to pre built dashboards, automated service maps, and intelligent anomaly detection algorithms that require virtually zero manual configuration.
Datadog excels in reducing the friction of operational visibility. By unifying logs, metrics, and traces under a single pane of glass, engineers can pivot seamlessly from a high level CPU spike on a Kubernetes node down to the specific application trace and log line that caused the anomaly. This deep correlation eliminates the need to cross reference multiple tools during an incident, drastically reducing mean time to resolution.
However, this convenience comes at a distinct cost. Datadog is a proprietary commercial platform, and its pricing model scales directly with your usage, whether measured by host count, ingested log volume, indexed spans, or custom metrics. For fast growing companies or organizations processing massive volumes of telemetry data, Datadog invoices can escalate rapidly if not actively monitored and managed.
Architectural Philosophies: Pull Versus Push
The most fundamental technical divergence between Prometheus and Datadog lies in how they ingest data. Prometheus operates on a pull model, while traditional monitoring agents often rely on a push model. While Datadog agents do push data to the Datadog backend, understanding the pull paradigm of Prometheus helps clarify why architectural preferences differ so sharply among engineering teams.
In a pull based system, the Prometheus server initiates the connection, scraping metrics from targets at regular intervals configured by the user. This architecture offers several distinct advantages. First, it provides load protection. If the Prometheus server becomes overwhelmed, targets are not impacted; they simply continue serving traffic normally while Prometheus scales back its scraping frequency or drops scrape cycles. Second, it ensures authenticity. If a target is scraping successfully, you know it is reachable and healthy. Third, it simplifies target discovery, especially in dynamic environments like Kubernetes where services constantly scale up and down via service discovery mechanisms.
The primary challenge with a pull architecture arises in network topologies with strict firewalls, network address translation, or private subnets where the central Prometheus server cannot reach individual pods or virtual machines. To bridge this gap, Prometheus relies on components like the Prometheus Pushgateway for short lived batch jobs, or specialized proxy configurations, which add operational complexity.
Datadog utilizes a push model where the Datadog agent running on your infrastructure collects data locally and actively transmits it outbound to Datadog cloud endpoints. This approach bypasses inbound firewall restrictions, making it exceptionally easy to monitor hybrid environments, edge devices, and multi cloud architectures without complex network routing adjustments. However, if network connectivity between your infrastructure and Datadog is interrupted, local buffering kicks in, but prolonged outages can result in data gaps or delayed ingestion when connectivity is restored.
Data Collection and Scope: Metrics Versus Full Stack Observability
When evaluating the scope of data collection, Prometheus and Datadog cater to different layers of the observability maturity model.
Prometheus is fundamentally a metrics engine. It is designed to collect, store, and query numerical time series data. While it handles numerical metrics with unmatched efficiency and speed, Prometheus by itself does not ingest logs or distributed traces. To achieve full observability with Prometheus, you must pair it with complementary open source projects. For logs, organizations typically pair Prometheus with Loki, an open source log aggregation system designed by Grafana Labs. For distributed tracing, teams integrate Jaeger or Zipkin. While this ecosystem approach is powerful and standardized around OpenTelemetry, it requires your engineering team to maintain multiple independent systems, handle separate storage scaling, and manage disparate configuration files.
Datadog, by contrast, was engineered from day one as an all in one platform. Its agent is a multi modal data collector capable of capturing infrastructure metrics, application performance monitoring traces, security telemetry, and structured or unstructured logs simultaneously. Because all these data types flow into the same underlying data lake within Datadog, the platform automatically builds relationships between them. You can click on a spike in a metric graph and instantly view the corresponding application traces and log entries without switching contexts.
Furthermore, Datadog includes advanced capabilities such as synthetic monitoring, where automated scripts test your web applications from global locations, and real user monitoring, which tracks client side performance in real browsers. Achieving this level of end to end visibility using open source tools requires assembling a complex toolchain of Prometheus, Loki, Grafana, OpenTelemetry collectors, and third party synthetic testing tools.
Query Languages and Data Analysis: PromQL Versus Datadog Query
An observability platform is only as powerful as the insights you can extract from its stored data during a high pressure production incident. The query language determines how quickly and accurately your engineers can diagnose anomalies.
Prometheus relies on PromQL, a strongly typed functional query language built specifically for multi dimensional time series data. PromQL treats all data as time series identified by a metric name and a set of key value label pairs. Its operators allow for complex mathematical and logical manipulations, such as calculating per second rates over sliding windows, aggregating across specific label dimensions using grouping operators, and performing vector matching.
sum(rate(http_requests_total{job="api-server"}[5m])) by (handler)
The example above demonstrates a typical PromQL query that calculates the per second rate of HTTP requests over a five minute window, grouped by the request handler. While PromQL has a steep learning curve for developers who are new to time series concepts, engineers who master it find it to be an expressive, predictable, and remarkably fast tool for extracting precise insights from metrics.
Datadog utilizes its own proprietary query language and UI based query builder. For most everyday tasks, Datadog provides a graphical interface where users can select metrics, apply aggregations, and filter by tags using drop down menus. This lowers the barrier to entry significantly, allowing junior engineers and product managers to build charts and investigate issues without learning a specialized syntax. For advanced use cases, Datadog supports formula and function capabilities, allowing users to perform arithmetic operations across multiple metrics and apply machine learning functions like anomaly detection and forecasting.
While Datadog query builders are more accessible out of the box, PromQL offers deeper deterministic control for complex mathematical modeling of time series data. However, Datadog’s true strength lies in its cross product querying, allowing you to correlate log event counts directly with metric values and trace latencies in a single view.
Cost Dynamics: Total Cost of Ownership Explored
Financial considerations often dictate the outcome of infrastructure software evaluations. The cost structures of Prometheus and Datadog represent two opposite ends of the software economic spectrum.
Prometheus is free software licensed under the Apache 2.0 license. There are no licensing fees, no per seat costs, and no usage based metering. However, labeling Prometheus as free is a common misconception. The true cost of Prometheus is encapsulated in its Total Cost of Ownership. Running Prometheus at scale requires dedicated engineering hours for deployment, configuration management, scaling, storage provisioning, backup management, and high availability tuning.
When you factor in the engineering salaries required to maintain a robust, scalable Prometheus and Thanos stack across multiple Kubernetes clusters, the personnel cost becomes substantial. Additionally, infrastructure costs for storage volumes and compute instances to run the time series databases must be accounted for. For organizations with strong platform engineering teams, these costs are predictable and often scale favorably compared to SaaS pricing.
Datadog operates on a usage based SaaS subscription model. You pay for what you use, with pricing tiers based on host counts, log gigabytes ingested, custom metrics volume, and trace spans indexed. While this model eliminates all infrastructure management overhead, server provisioning, and maintenance costs, it can introduce financial unpredictability.
Many engineering organizations experience sticker shock when their Datadog invoice scales unpredictably due to sudden traffic spikes, verbose application logging, or developers inadvertently introducing high cardinality custom metrics. Datadog provides usage monitoring dashboards and budgeting alerts, but keeping costs under control requires proactive governance, continuous metric pruning, and strict log sampling policies. For resource constrained startups or enterprises with massive data volumes, Datadog can represent a significant operational expense.
Ease of Setup and Operational Overhead
Operational friction directly impacts how quickly your engineering organization can adopt and benefit from an observability tool.
Setting up Prometheus in a modern Kubernetes environment is relatively straightforward, especially with community tools like the Prometheus Operator and the kube-prometheus-stack Helm chart. These tools automate the deployment of Prometheus, Alertmanager, and Grafana, while automatically discovering pods, services, and endpoints across the cluster. However, configuration errors in PromQL alerts, scraping timeouts, or mismanaged retention policies can lead to silent data loss or alert fatigue. As your infrastructure grows, maintaining Prometheus requires specialized expertise in container orchestration, persistent storage management, and distributed systems architecture.
Datadog champions ease of use and rapid time to value. Installing the Datadog agent typically requires running a single command or deploying a DaemonSet via Helm in your Kubernetes clusters. Once deployed, the agent automatically discovers running runtimes, databases, and message queues, immediately streaming telemetry to your Datadog account.
Within minutes, your teams have access to pre configured dashboards for standard technologies like PostgreSQL, Redis, Nginx, and Kafka without writing a single line of configuration code. The operational overhead is shifted entirely to Datadog’s cloud infrastructure. Your engineers spend zero time managing database compaction, storage scaling, or agent updates, freeing them up to focus on core product development.
Ecosystem, Community, and Extensibility
The long term viability of any software tool depends heavily on its community, ecosystem integrations, and extensibility.
Prometheus benefits from being a foundational pillar of the Cloud Native Computing Foundation. It enjoys massive community adoption, meaning nearly every open source cloud native project ships with native Prometheus metrics endpoints out of the box. Whether you are using Envoy, Kafka, Spark, or Postgres, you can almost guarantee that a Prometheus exporter exists or is built into the software.
Furthermore, Prometheus is tightly aligned with OpenTelemetry, the industry standard framework for collecting telemetry data. This open ecosystem ensures that you are never locked into a single vendor. If you decide to move away from Grafana or change your storage backend, your instrumentation remains entirely valid because it adheres to open standards.
Datadog also boasts an extensive ecosystem with hundreds of out of the box integrations covering cloud providers, SaaS tools, databases, and CI/CD pipelines. However, Datadog is a proprietary platform. While it supports OpenTelemetry ingestion, its deepest integrations, specialized features, and proprietary machine learning algorithms are tied to the Datadog ecosystem.
Opting for Datadog means entering a closed garden. Migrating away from Datadog later, should business requirements or pricing models change, can be a complex and disruptive undertaking requiring significant refactoring of application instrumentation and alert definitions.
Security, Compliance, and Data Governance
In an era of stringent data privacy regulations like GDPR, HIPAA, and SOC 2, how and where your monitoring data is stored and processed is of paramount importance.
With Prometheus, your data never leaves your infrastructure. You retain 100 percent sovereignty over your metrics, logs, and traces. You decide the retention period, where the storage volumes reside, who has access to the database instances, and how data is encrypted at rest and in transit. This makes Prometheus and its open source stack ideal for highly regulated industries, government agencies, and financial institutions with strict data residency requirements that prohibit sending production telemetry to third party SaaS providers.
Using Datadog means transmitting your operational telemetry, which often contains sensitive application logs, user identifiers, and infrastructure metadata, to Datadog’s cloud servers. While Datadog provides robust security certifications, encryption, and compliance frameworks, the data is still stored outside your direct perimeter. Datadog offers features like sensitive data scanner pipelines to redact personally identifiable information before it leaves your network, but ensuring strict compliance requires diligent configuration and oversight of your data ingestion pipelines.
When to Choose Prometheus
Deciding between Prometheus and Datadog depends entirely on your organizational context, team composition, and technical requirements. Prometheus is the optimal choice for specific operational profiles.
You should choose Prometheus if your infrastructure is heavily containerized and centered around Kubernetes, where the Prometheus operator can automate cluster monitoring with minimal friction. Prometheus is also the right fit if your organization has dedicated platform engineers or Site Reliability Engineers who possess the expertise to manage, scale, and troubleshoot open source monitoring stacks.
If your primary observability need is high performance metric collection and alerting without the immediate requirement for integrated log management and tracing, Prometheus delivers unmatched efficiency and zero licensing costs. Finally, if your organization operates under strict regulatory frameworks that mandate complete data ownership and local data residency, Prometheus provides the necessary sovereignty.
When to Choose Datadog
Conversely, Datadog shines in environments where operational speed, comprehensive coverage, and reduced administrative overhead take precedence over software licensing costs.
You should choose Datadog if your engineering team is lean and lacks dedicated platform or reliability engineers to manage complex open source monitoring infrastructure. Datadog eliminates the burden of infrastructure maintenance, allowing your developers to focus entirely on building product features.
If your organization requires a unified observability platform where metrics, logs, application traces, security insights, and user monitoring are seamlessly correlated in a single interface, Datadog provides an unmatched user experience. Furthermore, if you operate a complex hybrid or multi cloud environment where setting up custom scraping infrastructure is hindered by network boundaries, Datadog’s push based agent architecture simplifies deployment immensely.
Making the Right Choice for Your Engineering Organization
The debate between Prometheus and Datadog ultimately boils down to a classic engineering trade off between operational control and operational convenience.
Prometheus offers total sovereignty, immense power, and zero licensing costs at the expense of infrastructure management overhead and the need to assemble a broader ecosystem for logs and traces. Datadog offers turnkey convenience, stellar out of the box correlation, and reduced administrative burden at the cost of proprietary vendor lock in and potentially high, unpredictable financial expenditure at scale.
Many mature organizations adopt a hybrid mindset. They use Prometheus for high frequency, cost effective infrastructure metrics inside their Kubernetes clusters while evaluating specialized tools or leveraging Datadog selectively for specific application performance monitoring use cases.
Evaluate your team size, your budget flexibility, your compliance requirements, and your long term architectural roadmap carefully. By aligning your observability choice with your core organizational strengths, you will build a resilient, transparent engineering environment capable of supporting your business growth for years to come.