


Every system administrator, power user, and casual computer owner has experienced the sudden, chilling drop in performance that occurs when a machine grinds to an absolute halt. You open your task manager or resource monitor, expecting to find a runaway web browser tab, a heavy background render, or a rogue background update consuming every available clock cycle. Instead, you encounter a baffling paradox. The processor is pinned at one hundred percent utilization, yet the individual process list shows nothing substantial. Your mouse moves with agonizing sluggishness, clicks take minutes to register, and the system fan screams at maximum velocity.
When your processor is pegged at maximum capacity without a clear software culprit, human instinct usually points toward malware, operating system bloat, or background indexing services. However, seasoned systems engineers know that the root cause frequently lies in a completely different physical layer of the machine. The storage subsystem. A failing hard drive or a degrading solid-state drive can quietly hijack your processor, plunging the system into a debilitating state of resource starvation.
Understanding this hidden link requires looking beneath the polished user interface of modern operating systems down to the metal. It involves examining how the Linux kernel, the Windows I/O manager, and device controllers handle hardware failures. When storage hardware begins to fail, it does not always simply stop working. Instead, it enters a twilight zone of degraded performance, endless error correction loops, and hardware interrupts that can overwhelm even the most powerful multi-core processors.
Decoding the Metrics: Understanding CPU Utilization Beyond the Surface
To comprehend why a failing storage device causes high CPU usage, you must first understand how operating systems measure processor activity. CPU usage is not a monolithic metric. It is broken down into distinct states that tell a critical story about what your processor is actually doing at any given microsecond.
In Unix and Linux environments, these states include user time, system time, idle time, and iowait time. User time measures the percentage of CPU cycles spent executing normal application code. System time measures the time spent running kernel code, which handles low-level tasks like memory management, device drivers, and system calls. Idle time represents the percentage of time the processor is sitting completely dormant, waiting for instructions.
Then comes the metric that often holds the secret to storage-induced performance degradation: iowait. While technically a subset of idle time in some monitoring tools, iowait measures the percentage of time the CPU is waiting for outstanding input and output requests to complete. When a storage device functions normally, data flows seamlessly between volatile system memory and persistent storage media. The CPU dispatches a read or write instruction to the disk controller and quickly moves on to other tasks, occasionally checking back or receiving an interrupt when the operation finishes.
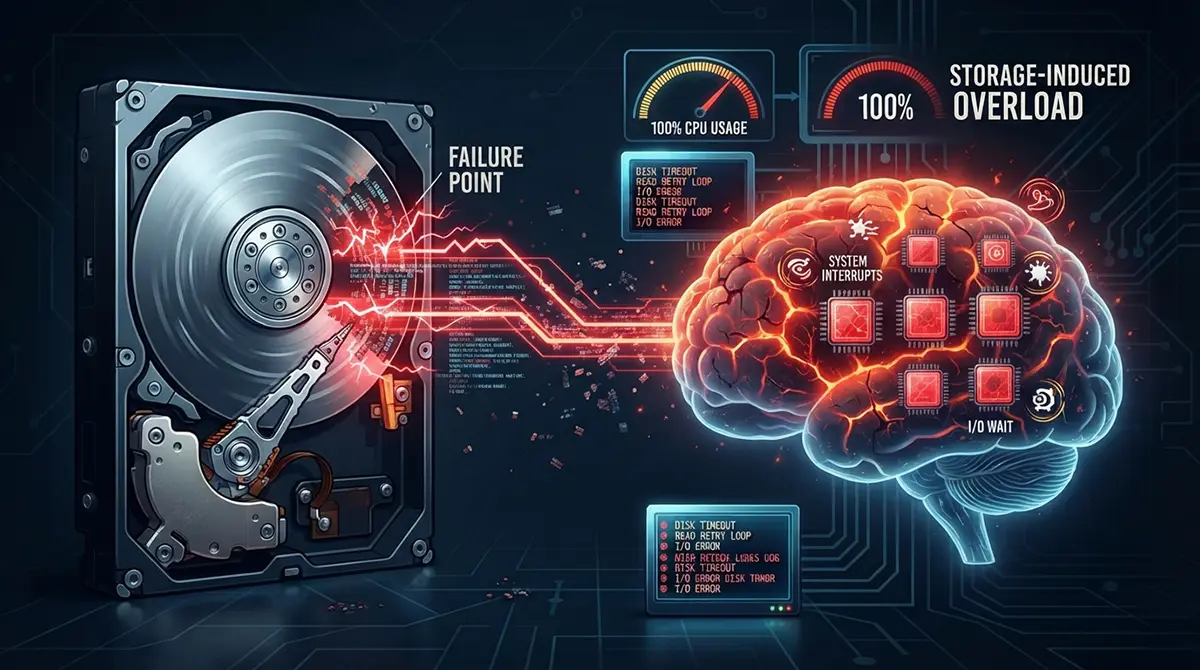
When a hard drive begins to fail, the delicate rhythm of data transmission collapses. The drive can no longer fulfill read and write requests within acceptable timeframes. Consequently, the operating system kernel is forced to queue these operations. Processes requesting data enter an uninterruptible sleep state. While the CPU cores themselves may technically spend a significant portion of this time waiting, the cascading effects of driver retries, error logging, and context switching can drive system CPU usage sky-high. The processor spends an enormous amount of energy managing the chaos of a storage device that is struggling to communicate.
The Mechanical Torture: How Failing Hard Drives Hijack Your Processor
Traditional mechanical hard disk drives rely on spinning magnetic platters, precision actuator arms, and microscopic read and write heads floating on cushions of air. This intricate mechanical ballet is prone to physical wear and tear over years of continuous operation. When a mechanical drive begins to fail, the physical degradation directly translates into computational overhead.
Consider what happens when a hard drive encounters a bad sector. A bad sector is a tiny region of the magnetic platter that can no longer reliably retain or magnetic data. When the operating system requests data residing on or near a failing sector, the drive firmware attempts to read the sector multiple times, often adjusting the read head’s voltage, repositioning the actuator arm with microscopic precision, and employing complex error correction code algorithms to reconstruct the unreadable data.
This process is known as a read retry loop. While the physical read head desperately tries to recover the failing bits, the drive controller holds off on returning a response to the host operating system. The operating system, in turn, waits for the disk. If the drive is executing thousands of retries across multiple fragmented files, the storage controller becomes entirely consumed by recovery routines.
From the operating system perspective, this manifests as extreme latency. The kernel’s storage driver must handle continuous timeouts, abort commands, and reset signals sent to the storage controller. Every single one of these hardware-level events triggers interrupts that the CPU must service. The processor is repeatedly interrupted from its normal execution flow to handle the stubborn, unresponsive storage controller. This constant interruption breaks CPU caches, triggers massive context switching overhead, and sends system CPU usage soaring as the kernel spends all its time managing I/O queues that refuse to drain.
Looking for Enterprise-Grade DevOps Services in Dubai?
Scaling your infrastructure, automating deployments, and ensuring 99.9% uptime shouldn’t be a bottleneck for your business. Whether you need robust CI/CD pipelines, containerization with Docker and Kubernetes, or secure cloud architecture, We can help you streamline your operations. Let’s optimize your IT environment Get in touch with us today to discuss your project.
Solid State Surprises: Controller Failures and NAND Degradation
Many people assume that upgrading from a mechanical hard drive to a solid-state drive eliminates storage-induced performance bottlenecks. While SSDs offer blistering speeds and lack moving parts, they are not immune to failure modes that can equally devastate CPU performance. In fact, failing solid-state drives can introduce unique processor overheads that are even more insidious than mechanical failures.
Solid-state drives rely on flash memory cells and sophisticated onboard microcontrollers running proprietary firmware. This controller manages wear leveling, garbage collection, error correction, and translation between logical block addresses and physical flash memory locations. When an SSD begins to degrade, typically due to NAND flash wear-out, manufacturing defects, or corrupted firmware state tables, the onboard controller can enter a state of continuous panic.
As flash memory cells age, the voltage required to accurately read and write data drifts. The SSD controller must apply increasingly aggressive error correction mechanisms, such as low-density parity-check algorithms, every time a read or write operation is performed. These algorithms are computationally intensive, even for the dedicated processor inside the SSD. If the internal controller becomes overwhelmed, it may throttle its own performance, drop into safe mode, or flood the host interface with error states.
When connected via high-speed interfaces like NVMe or SATA, a struggling SSD can overwhelm the host operating system’s device drivers. The kernel’s NVMe driver, for instance, might find itself constantly resetting the controller, clearing command queues, and dealing with dropped PCIe link states. These driver-level recovery loops consume massive amounts of system CPU time. Furthermore, because operating systems often rely on virtual memory paging and swap spaces located on fast storage, an unresponsive SSD freezes application threads across the entire system. This forces the CPU to manage a traffic jam of stalled virtual memory operations, culminating in a system that appears frozen despite having ample processing power on paper.
The Kernel Log Flood and Interrupt Storms
One of the most telling indicators that a failing hard drive is choking your CPU can be found by examining your system logs. When storage hardware encounters persistent read and write errors, the operating system kernel does not simply ignore the problem. It dutifully records every single failure, timeout, and hardware warning into the system log files.
Under severe hardware degradation, a failing drive can generate hundreds or even thousands of error messages per second. In a Linux environment, commands like dmesg or log files under the var log directory will overflow with terrifying warnings regarding sector read failures, ATA reset timeouts, and I/O errors on specific storage devices. While logging errors is essential for diagnostics, the act of writing these logs creates a vicious computational feedback loop.
Consider the mechanics of logging. To record an error message, the kernel must allocate memory, format string data, acquire locks, and write the log entries to disk. But where are these log files stored? They are written to the very same storage subsystem that is currently failing. As the kernel attempts to write thousands of error logs to a degraded drive, the drive struggles even harder to process the incoming writes, generating more errors, which in turn generates more log entries.
This phenomenon consumes significant CPU cycles. The processor is trapped in a loop of handling disk errors, writing log entries about those disk errors to the failing disk, experiencing timeouts on those writes, and generating new error entries to document the timeouts. Alongside this logging storm, the hardware generates continuous interrupt requests. Every time the storage controller wants to report a status change, an error, or the completion of a failed command, it fires an electrical signal to the CPU interrupt pin or uses Message Signaled Interrupts over the PCIe bus. An interrupt storm can capture a CPU core completely, leaving zero cycles available for user applications and rendering the machine entirely unresponsive.
Diagnosing the Ghost in Your Machine
When faced with a system suffering from mysterious high CPU usage and sluggish responsiveness, effective troubleshooting requires a methodical approach that looks past traditional application monitoring. You must interrogate the storage subsystem directly to determine if hardware failure is the hidden culprit.
The first step in modern systems analysis is observing real-time disk activity alongside CPU metrics. Tools like top and htop provide a general overview, but specialized utilities like iotop or atop offer granular visibility into input and output operations. If you observe that processes are stuck in a constant state of high iowait, or if specific system processes related to storage drivers are consuming abnormal amounts of system CPU time, your suspicions should immediately turn toward the storage layer.
Next, you must investigate the kernel ring buffer using diagnostic commands. Reviewing recent kernel messages will quickly reveal whether the storage controller is throwing hardware errors, sector remapping warnings, or communication timeouts. If you see recurring references to drive controllers resetting or unrecovered read errors, the physical integrity of the drive is already compromised.
The definitive test for storage hardware health involves querying the Self-Monitoring, Analysis, and Reporting Technology data embedded within the drive itself. Command-line utilities allow administrators to inspect SMART attributes on both SATA and NVMe drives. You should examine critical health indicators such as reallocated sector counts, pending sector counts, uncorrectable sector errors, and media wear indicators. If the pending sector count is rising, it means the drive has identified damaged physical sectors and is waiting for an opportunity to remap them using spare capacity. If those sectors cannot be successfully read before remapping, data loss is imminent, and the constant retry attempts are precisely what has been driving your CPU utilization through the roof.
RAID, ZFS, and the Parity Penalty of Failing Hardware
The situation becomes exponentially more complex when failing hard drives reside within a redundant array of independent disks, a software RAID configuration, or an advanced file system like ZFS. While redundancy protects against sudden catastrophic hardware loss, a degraded array containing a failing drive can subject your CPU to punishing computational workloads.
Consider a software RAID 5 or RAID 6 array, or a ZFS pool with parity configuration. In these environments, data is distributed across multiple physical drives along with mathematical parity information. This ensures that if a single drive completely fails, the array can continue operating without data loss, and the missing data can be calculated on the fly using parity blocks.
However, when a drive does not completely fail, but instead enters a degraded state of intermittent responsiveness and slow read speeds, the storage pool enters a performance nightmare. Every time an application requests data that resides on the struggling drive, the storage layer must wait for that drive to respond. If the drive takes too long, the controller or file system may timeout and instead reconstruct the requested data from parity blocks distributed across all the healthy drives.
Parity reconstruction is a mathematically intensive operation. It requires reading data from every other operational disk in the array and performing heavy bitwise XOR calculations in memory. When a failing drive forces the system to constantly calculate parity on the fly, your CPU cores are subjected to a relentless computational burden. The processor is no longer just running your operating system and applications; it is acting as a real-time data reconstruction engine, struggling to keep up with the cascading latency introduced by a single dying hard drive.
Emergency Recovery and Actionable Remediation
Discovering that a failing hard drive is the root cause of your high CPU usage requires immediate, decisive action. Storage hardware degradation is a progressive condition that rarely improves on its own. Delaying remediation almost invariably leads to complete catastrophic data loss.
Your absolute first priority when dealing with a failing drive is data preservation. Before attempting any aggressive repairs, file system checks, or hardware stress tests, you must secure a complete backup or disk image of all critical data. Because the drive is already unstable, standard file copying procedures may fail or cause the drive to lock up entirely. Advanced system administrators often employ specialized block-level cloning tools designed to bypass bad sectors, read data around damaged regions, and salvage as much information as possible before the drive gives up the ghost entirely.
Once your data is safely secured, the physical remediation step is straightforward: replace the failing drive immediately. Continuing to operate a machine with a failing hard drive is an exercise in futility that risks corrupting entire file systems and wasting countless hours of troubleshooting time.
After installing a healthy replacement drive and restoring your data or operating system image, you must perform file system integrity validation. Tools designed to check and repair file system structures should be run to ensure that no orphaned data blocks or corrupted directory entries remain from the period of hardware failure. Finally, establish proactive monitoring infrastructure. Implementing long-term telemetry collection ensures that future storage degradation is caught via early warning metrics, such as rising SMART attribute thresholds, long before the drive enters a failure state that cripples your CPU and halts your workflow.
Building a Resilient Future Against Storage Degradation
The hidden link between failing hard drives and high CPU usage serves as a powerful reminder of how deeply interconnected every component of a computer system truly is. Software performance cannot exist in a vacuum. It relies entirely on the unwavering reliability of the underlying physical hardware. When the storage layer stumbles, the processor bears the brunt of the administrative chaos, translating physical wear and tear into computational gridlock.
By recognizing the subtle symptoms of storage failure, looking beyond simple task manager process lists, and understanding how kernel drivers, interrupt storms, and parity calculations interact with failing hardware, you transform from a reactive troubleshooter into a proactive systems architect. Regular hardware audits, vigilant monitoring of SMART telemetry, and rapid replacement of aging storage media ensure that your systems remain lightning fast, reliable, and free from the phantom load of failing drives.