
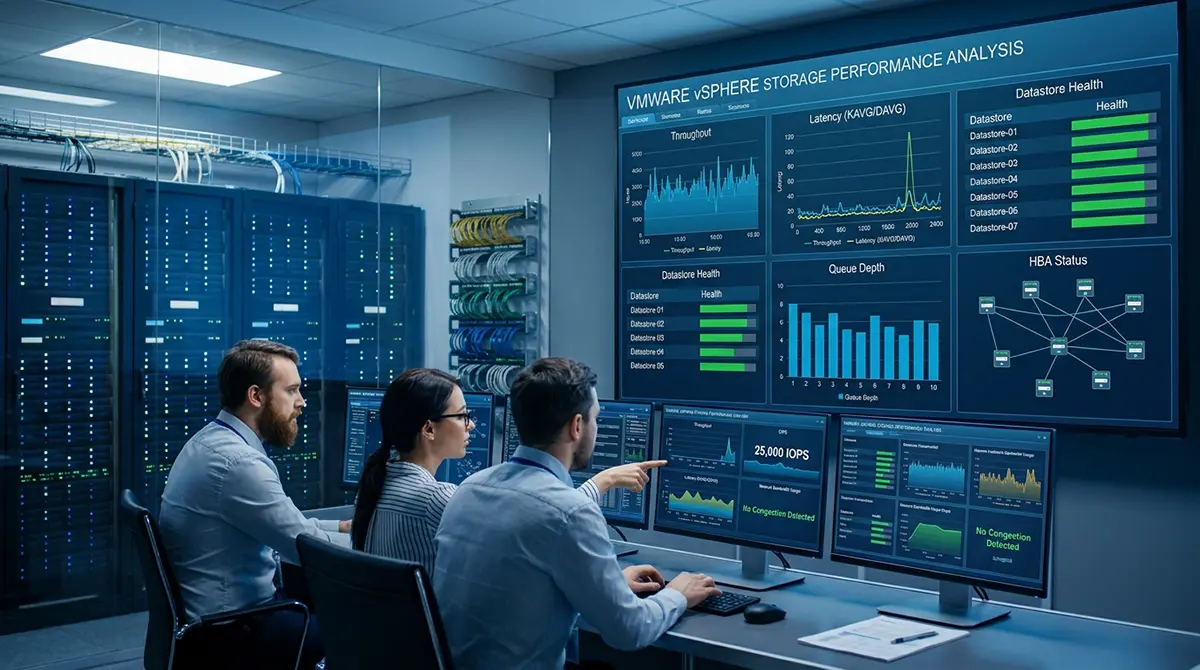



Enterprise virtualization environments rely heavily on the continuous availability and lightning-fast responsiveness of underlying storage subsystems. In a VMware vSphere architecture, storage is frequently the primary governor of application performance. While CPU and memory resources are relatively straightforward to schedule and isolate, storage I/O involves a complex web of hypervisor drivers, storage network fabrics, queue depths, array controllers, and solid-state or spinning physical media. When storage underperforms, the ripple effect degrades database throughput, increases user application latency, and exhausts hypervisor operational buffers.
Understanding VMware storage performance analysis and monitoring requires looking past aggregate statistics like total megabytes per second. Effective performance management demands a clear grasp of how storage commands traverse the virtualization layer, how to measure delays at each hop, and how to configure vSphere parameters to eliminate bottlenecks. By taking a systematic approach to monitoring latency, IOPS, and queueing, administrators can maintain high storage health and unlock maximum performance across enterprise workloads.
Deciphering the Core Metrics of Storage Health
To analyze storage health accurately, administrators must separate storage metrics into distinct operational categories. Mixing up throughput, operations per second, and latency often leads to incorrect diagnostic conclusions.
-
Latency (Kernel, Device, and Total): Latency measures the time required for a storage command to complete, typically reported in milliseconds. In vSphere, total guest latency (KAVG/GAVG) is divided into Kernel Latency (KAVG) and Device Latency (DAVG). Kernel latency represents the time an I/O request spends waiting inside the ESXi hypervisor storage stack before being sent to the hardware. High kernel latency points to local queuing issues, host CPU contention, or overly restrictive Storage I/O Control (SIOC) settings. Device latency measures the duration from when the ESXi host issues the command to the physical storage device until the device acknowledges completion. High device latency indicates overloaded array controllers, saturated fabric fabrics, or slow physical media.
-
Input/Output Operations Per Second (IOPS): IOPS tracks the total count of read and write commands processed every second. While IOPS is a common marketing metric for storage arrays, high IOPS numbers are meaningless without context regarding payload block sizes and latency. Processing ten thousand 4KB block requests requires vastly different system resources than processing ten thousand 64KB block requests.
-
Throughput (MBps or GBps): Throughput measures the total volume of data transferred over time. It is calculated by multiplying IOPS by the average I/O block size. High-throughput workloads like data warehousing or video streaming saturate network bandwidth quickly, whereas transaction-oriented databases depend far more on low IOPS latency.
-
Queue Depth and Command Aborts: Queue depth defines how many pending storage commands an ESXi host, HBA driver, or storage array LUN can process concurrently. When a storage queue fills completely, subsequent commands are queued back into the ESXi storage stack or throttled by array abort commands. Frequent queue saturation degrades performance and triggers noticeable latency spikes for guest virtual machines.
Looking for Enterprise-Grade DevOps Services in Dubai?
Scaling your infrastructure, automating deployments, and ensuring 99.9% uptime shouldn’t be a bottleneck for your business. Whether you need robust CI/CD pipelines, containerization with Docker and Kubernetes, or secure cloud architecture, We can help you streamline your operations. Let’s optimize your IT environment Get in touch with us today to discuss your project.
The ESXi Storage Path and Where Bottlenecks Occur
A storage command issued by an application inside a virtual machine travels through multiple virtual and physical translation layers before reaching physical storage media. Identifying performance bottlenecks requires tracing this exact path.
Inside the virtual machine, the guest operating system issues an I/O request through its native file system. This request passes to a virtual storage controller, such as the VMware Paravirtual SCSI (PVSCSI) or NVMe adapter. The virtual device converts the request into hypervisor commands and passes it to the ESXi VMkernel layer.
Once in the VMkernel, the request enters the vSphere storage stack. Here, policies like Storage I/O Control (SIOC) evaluate the traffic to prioritize high-priority workloads if contention exists. Next, the multipathing software, such as VMware Native Multipathing Plugin (NMP), selects the appropriate physical Host Bus Adapter (HBA) port and physical path based on policies like Round Robin or Fixed Path.
Finally, the command leaves the host hardware and travels across the Storage Area Network (SAN), Network Attached Storage (NAS) fabric, or local bus to the physical storage controller. The controller processes the data across its cache and physical disks, returning an acknowledgment back up the inverse path. A bottleneck can form at any link in this chain, including undersized virtual adapters, misconfigured host queues, saturated network switches, or exhausted array cache.
Essential Tools for Monitoring VMware Storage Performance
VMware administrators have several built-in and enterprise tools available to collect metrics, build baseline models, and troubleshoot active incidents.
-
esxtop and resxtop: The esxtop utility is the definitive command-line tool for real-time ESXi performance troubleshooting. By navigating to the storage device screen (pressing d) or the virtual disk screen (pressing v), administrators can inspect instantaneous read/write metrics, command aborts, queue depths, and latency counters (KAVG, DAVG, GAVG). It provides zero-delay insight directly from the hypervisor host kernel.
-
vCenter Performance Charts: Located within the vSphere Client, performance charts offer both real-time and historical views of storage performance across virtual machines, datastores, hosts, and clusters. Real-time charts capture data in 20-second intervals, while historical charts aggregate data over days, months, or years to assist with capacity planning and trend analysis.
-
VMware vRealize Operations / VMware Aria Operations: For large-scale enterprise environments, Aria Operations provides automated monitoring, predictive capacity planning, and dynamic anomaly detection. It uses machine learning models to establish normal baseline behaviors for storage metrics, automatically raising alerts when abnormal latency or queuing behavior is detected before end-users experience performance issues.
-
Array-Native Storage Analytics: Hypervisor-level monitoring must always be cross-referenced with SAN/NAS storage array dashboards. Storage arrays offer unique metrics unavailable to vSphere, such as controller CPU utilization, internal tiering status, deduplication/compression processing overheads, and write-cache saturation levels.
Best Practices for Optimizing Datastores and Virtual Disks
Configuring virtual disks and datastores correctly during initial deployment prevents structural performance issues that are difficult to fix later.
-
Right-Sizing Virtual Disk Controllers: Always use modern, low-overhead virtual storage controllers. Modern operating systems running performance-sensitive workloads should leverage VMware Paravirtual SCSI (PVSCSI) or NVMe virtual adapters rather than legacy LSI Logic controllers. PVSCSI and NVMe adapters dramatically reduce ESXi CPU utilization and increase maximum I/O throughput by handling high-queue environments efficiently.
-
Multi-Controller Virtual Machine Architecture: High-demand virtual machines, such as heavy SQL Server or Oracle database nodes, should split their disk volumes across multiple virtual storage controllers. Assigning operating system files, database data files, and database transaction logs to distinct virtual storage adapters creates independent command queues, eliminating artificial queuing inside the virtual machine.
-
Datastore Sizing and LUN Aggregation: Striking the right balance between datastore size and virtual machine density is critical. Placing too many high-I/O virtual machines on a single VMFS datastore creates disk queue contention (LUN queue saturation) and increases SCSI reservation conflicts. Conversely, creating dozens of tiny datastores increases administrative overhead and fragments storage space. Administrators should cluster workloads onto datastores based on performance profiles and I/O characteristics.
-
Alignment and Thin Provisioning Management: Ensure that guest operating system partitions are properly aligned to physical disk block boundaries. Unaligned partitions force a single guest I/O request to cross multiple underlying physical storage blocks, doubling the overall I/O burden. Additionally, while thin-provisioned virtual disks offer space savings, initial space allocation events incur minor latency penalties. For ultra-latency-sensitive workloads, thick provisioning (Eager Zeroed) guarantees pre-allocated space and consistent latency response times.
Navigating Advanced VMware Storage Architectures
Modern VMware environments frequently move beyond traditional Fibre Channel or iSCSI SAN arrays, adopting hyperconverged infrastructure (HCI) like VMware vSAN or Next-Gen Fabrics like NVMe over Fabrics (NVMe-oF). Monitoring these environments requires an updated analytical approach.
-
VMware vSAN and Hyperconverged Storage Metrics: In a vSAN environment, traditional datastore counters are replaced by software-defined distributed storage paths. Administrators must monitor vSAN-specific layers, including the Client (vSCSI) layer, the Distributed Object Manager (DOM), and the Local Log (LSOM) physical disk layer. Monitoring disk group write-buffer cache usage is paramount. If a write-heavy workload fills the vSAN cache layer faster than it can be de-staged to the capacity tier, write performance plummets. Using vSAN Express Storage Architecture (ESA), NVMe-native pools eliminate traditional disk groups, but monitoring host CPU and high-speed network interfaces becomes critical due to the elevated I/O rates.
-
NVMe over Fabrics (NVMe-oF): Implementing NVMe-oF over Fibre Channel (FC-NVMe) or RDMA/RoCE (NVMe/TCP, NVMe/RDMA) dramatically slashes storage protocol latency compared to traditional SCSI stacks. However, NVMe architectures handle command queues differently, supporting tens of thousands of queues with deep parallel processing. Monitoring NVMe storage involves tracking queue allocation balances, network interface dropped packets, and host fabric adapter performance.
-
Storage I/O Control (SIOC) Implementation: Storage I/O Control monitors datastore latency across an entire vSphere cluster. When latency exceeds a user-defined threshold, SIOC dynamically throttles low-priority virtual machines while prioritizing latency-sensitive VMs using assigned I/O shares. Enabling SIOC prevents noisy-neighbor virtual machines from consuming shared datastore resources during unexpected I/O spikes.
Troubleshooting Real-World Storage Performance Bottlenecks
When users complain of slow application response times, administrators must follow a methodical diagnostic workflow to identify and resolve the root cause. Step one involves validating guest-level performance metrics. Check the guest operating system task manager or monitoring agent to confirm whether the application latency originates within the guest OS kernel or the hypervisor tier. High disk queue length combined with elevated response times in the guest confirms storage strain.
Step two requires opening esxtop on the ESXi host running the troubled virtual machine. Navigate to the virtual disk view and check the GAVG (Guest Average Latency), KAVG (Kernel Average Latency), and DAVG (Device Average Latency) figures.
If KAVG is high while DAVG remains low, the bottleneck sits inside the ESXi hypervisor stack. Check if the virtual machine has exceeded its maximum adapter queue depth. Review whether Storage I/O Control is actively throttling the VM due to share limits, or verify if the ESXi host CPU is so overcommitted that it cannot process storage interrupts promptly.
If DAVG is high while KAVG remains negligible, the bottleneck resides outside the ESXi host. Inspect the physical network or Fibre Channel switch fabrics for CRC errors, port drops, or buffer credits exhaustion. Next, check the SAN array management interface to determine if controller CPU utilization has peaked, cache mirroring is disabled, or a background task like array rebuilding or tiering is consuming physical disk IOPS.
Finally, check for command aborts and reset counters (ABRT/S in esxtop). Non-zero abort rates indicate that the storage path is completely failing to process commands within timeout limits, often caused by hardware faults, bad cables, firmware bugs, or severe array overload.
Establishing a Proactive Baseline Strategy
Effective storage management relies on proactive maintenance rather than reactive troubleshooting. Without an established performance baseline, it is impossible to determine whether an operational metric is normal or abnormal for a specific environment.
-
Document Baseline Metrics: Collect baseline data for latency, IOPS, and throughput during steady-state business operations, peak workload windows, and off-peak maintenance cycles (such as backup windows). Knowing that a core database datastore normally operates at 2 ms device latency allows administrators to set meaningful alert thresholds (such as triggering an alert if latency sustains above 12 ms).
-
Schedule Workload Distribution: Stagger automated scheduled events that generate massive I/O loads. Antivirus scans, guest operating system patch cycles, automated desktop pool refreshes, and full database backups should never run concurrently on shared storage infrastructure.
-
Continual Firmware and Driver Alignment: Ensure that HBA drivers, storage array controllers, and switch firmware match the exact recommendations on the VMware Compatibility Guide. Out-of-date or mismatched storage drivers frequently introduce memory leaks, improper queue handling, or sub-optimal multipathing decisions under heavy I/O loads.
Consistently monitoring and analyzing storage performance transforms a reactive IT management model into an efficient, optimized operation. By mastering native hypervisor metrics, understanding storage protocol paths, leveraging modern hardware architectures, and systematically isolating bottlenecks, administrators can ensure that their VMware infrastructure delivers high performance, reliability, and stability for enterprise workloads.