


When engineering teams embark on building or modernizing a cloud-native infrastructure, they invariably encounter three acronyms that dominate every architectural discussion. Prometheus, Grafana, and OpenTelemetry are the foundational pillars of modern observability. Yet, asking which one of these technologies is better is akin to asking whether a steering wheel, an engine, or a dashboard is better in a car. They perform fundamentally different functions, and in most production environments, they work in harmonious concert rather than competing for dominance.
The evolution of distributed systems has transformed how we monitor software. Monolithic applications of the past could be understood with simple CPU and memory checks. Modern microservices, containerized clusters, and serverless deployments generate torrents of data that span multiple dimensions. To make sense of this chaos, organizations need to generate telemetry data, store and aggregate it, and visualize it in a way that drives rapid incident response and business decisions. This is where our three contenders enter the picture, each solving a distinct piece of a complex puzzle. Understanding their individual strengths, architectural boundaries, and symbiotic relationships is the only way to design a resilient telemetry pipeline.
Decoding Prometheus: The Unsung King of Time-Series Metrics
Prometheus burst onto the scene as an open-source systems monitoring and alerting toolkit designed to handle metrics collection at scale. Inspired by Google’s internal monitoring system Borgmon, Prometheus quickly became the gold standard for Kubernetes and cloud-native infrastructure monitoring. At its core, Prometheus is optimized for time-series data, meaning it records numerical information associated with timestamps and key-value pairs known as labels.
The architecture of Prometheus relies on a pull-based model. Instead of applications pushing data to a central server, Prometheus actively scrapes metrics from HTTP endpoints exposed by target services at regular intervals. This pull mechanism offers distinct advantages. It makes it easy to detect dead or unresponsive instances because if a target fails to respond, Prometheus immediately flags the missing data point. Furthermore, it puts the control of scraping frequency in the hands of the monitoring system rather than overwhelming downstream servers during traffic spikes.
Prometheus also introduced PromQL, a powerful query language purpose-built for slicing and dicing time-series data. PromQL allows engineers to compute rates, aggregate across dimensions, and build complex alerting rules with remarkable efficiency. Paired with its companion Alertmanager, Prometheus provides reliable incident routing, silencing, and grouping. However, Prometheus is not a silver bullet. It focuses exclusively on metrics. It does not natively handle distributed traces or logs, and its local storage model means that scaling to massive multi-cluster environments requires supplementary components like Thanos or Mimir.
Looking for Enterprise-Grade DevOps Services in Dubai?
Scaling your infrastructure, automating deployments, and ensuring 99.9% uptime shouldn’t be a bottleneck for your business. Whether you need robust CI/CD pipelines, containerization with Docker and Kubernetes, or secure cloud architecture, We can help you streamline your operations. Let’s optimize your IT environment Get in touch with us today to discuss your project.
Unmasking Grafana: The Visual Masterpiece and Observability Nexus
If Prometheus is the engine room measuring performance, Grafana is the command center where human operators interpret the data. Grafana is an open-source visualization and analytics software that connects to virtually any database or telemetry source to create stunning, interactive dashboards. Over the years, Grafana evolved from a simple graphing tool for Graphite and Prometheus into a sprawling ecosystem that unifies logs, metrics, and traces under a single pane of glass.
The primary superpower of Grafana lies in its versatility. It supports dozens of native data sources, allowing teams to pull metrics from Prometheus, logs from Loki, traces from Tempo, and data from traditional relational databases or commercial APM platforms into a single unified dashboard. This capability bridges the gap between disparate technical silos, enabling developers, site reliability engineers, and business stakeholders to look at the exact same system health indicators simultaneously.
Beyond visualization, Grafana has expanded its footprint through its own backend projects, including Grafana Mimir for scalable metrics storage, Grafana Loki for log aggregation, and Grafana Tempo for distributed tracing. This comprehensive suite allows organizations to build a complete observability stack using tooling anchored by Grafana’s visualization layer. Yet, Grafana itself does not collect data or store metrics out of the box. It relies entirely on external data sources to feed its panels, making it dependent on upstream ingestion frameworks.
Embracing OpenTelemetry: The Telemetry Standard That Conquered the Cloud
OpenTelemetry, often abbreviated as OTel, represents a massive paradigm shift in how applications generate and export telemetry data. Formed through the merger of OpenTracing and OpenCensus, OpenTelemetry is a vendor-neutral, Cloud Native Computing Foundation project that provides standardized APIs, SDKs, and tools for collecting metrics, logs, and traces.
Historically, engineering teams faced vendor lock-in because every monitoring platform required its own proprietary software development kit to instrument code. If a company decided to switch from one vendor to another, developers had to rewrite instrumentation code across hundreds of microservices. OpenTelemetry completely eliminated this friction. By establishing a universal standard for telemetry generation, OTel allows developers to instrument their applications once and route the resulting data to any compliant backend.
The architecture of OpenTelemetry features two primary components: client-side instrumentation libraries and the OpenTelemetry Collector. The collector acts as an independent proxy that can receive, process, and export telemetry data in various formats. It can transform metrics, filter out noisy span traces, and batch data before shipping it to destinations like Prometheus, Grafana Mimir, Jaeger, or commercial observability platforms. OpenTelemetry has achieved near universal adoption across major cloud providers and programming languages, establishing itself as the definitive default for modern software instrumentation.
Head-to-Head Breakdown: Core Architectural Differences
To truly understand how Prometheus, Grafana, and OpenTelemetry relate to one another, we must examine their architectural boundaries and operational scopes. While comparing them directly is difficult due to their overlapping yet distinct roles, analyzing specific dimensions reveals where each tool shines.
-
Scope and Data Types: OpenTelemetry is an instrumentation and collection framework that handles the holy trinity of observability, which includes metrics, logs, and traces. Prometheus is a dedicated metrics monitoring system featuring its own time-series database and query engine. Grafana is fundamentally a visualization and dashboarding platform that can also host backend storage engines within its broader ecosystem.
-
Collection Paradigms: Prometheus relies heavily on a pull-based scraping mechanism, pulling metrics from endpoints. OpenTelemetry primarily employs a push-based model where applications and collectors push data downstream, though it also supports receiving pulled metrics. Grafana remains passive, querying whichever data sources it is pointed toward.
-
Vendor Neutrality and Portability: OpenTelemetry was built from the ground up to be entirely vendor-neutral, ensuring your instrumentation code is never tied to a specific destination. Prometheus is open source under the Apache 2.0 license and forms an open ecosystem, though its native data format was historically proprietary to its architecture before the rise of OpenMetrics. Grafana operates under a mix of open source and proprietary licenses depending on the specific component and enterprise features, but it champions open data connectivity.
Synergy in Practice: Why You Usually Do Not Choose Just One
When practitioners ask which tool is better, they often labor under the misconception that they must select only one. In reality, modern observability architectures rely on all three working together in a seamless pipeline. Understanding how these tools complement each other reveals why pitting them against one another misses the true value proposition of each technology.
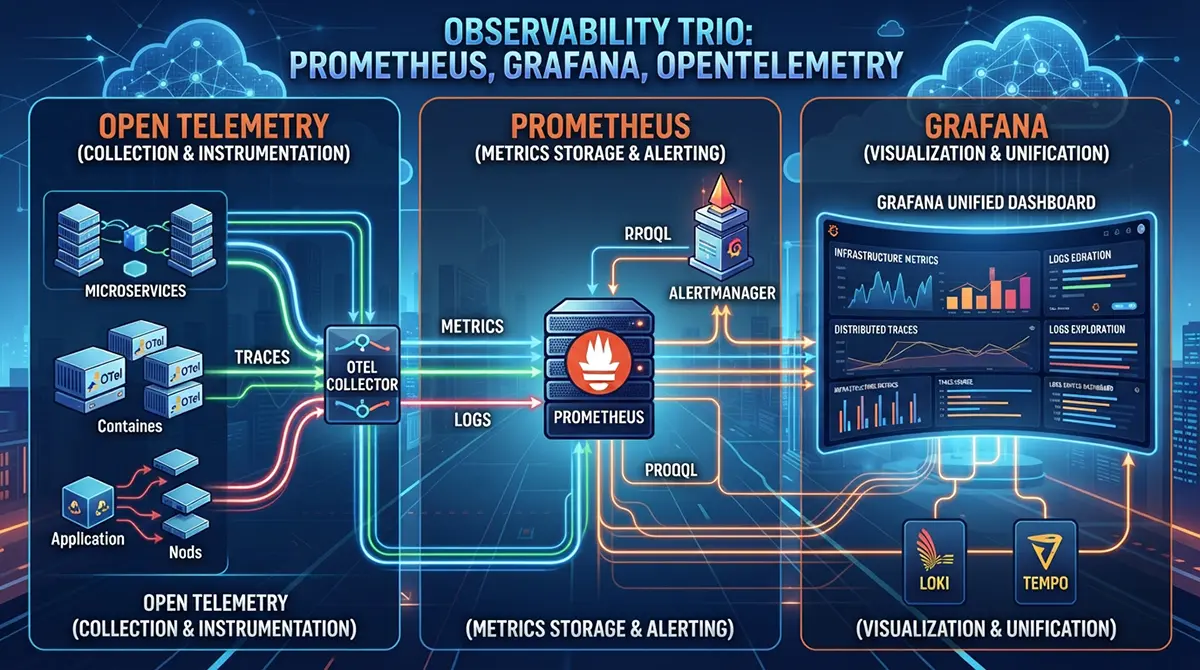
Imagine a typical cloud-native application running on a Kubernetes cluster. Developers use OpenTelemetry SDKs and auto-instrumentation packages to inject tracing and metrics capabilities into the application code without invasive manual changes. As the application runs, it exposes metrics and emits traces.
The OpenTelemetry Collector receives these signals, processes them, and routes metrics to a Prometheus server or a long-term storage backend like Mimir. At the same time, distributed traces are shipped to a trace storage engine like Tempo or Jaeger, while container logs flow into Loki. Finally, Grafana connects to Prometheus, Loki, and Tempo, assembling all these distinct data streams into unified operational dashboards.
In this architecture, OpenTelemetry handles the generation and transport layer, Prometheus handles reliable metric collection and high-speed alerting, and Grafana provides the human interface for analysis. Removing any single component degrades the capability of the entire pipeline, proving that they are teammates rather than rivals.
Cost, Scale, and Operational Complexity: The Hidden Trade-Offs
Deploying an open-source observability stack offers immense freedom and avoids licensing costs, but it introduces significant operational overhead. Organizations must evaluate whether their engineering teams have the bandwidth to manage and scale these tools, as each project carries distinct maintenance burdens.
Prometheus, for instance, scales exceptionally well for single clusters, but managing high cardinality metrics can quickly exhaust memory resources. Unique label combinations multiply rapidly, and if not carefully controlled, they can cause Prometheus servers to crash. Scaling Prometheus across multiple data centers or large enterprises requires supplementary tools like Thanos or VictoriaMetrics, which add architectural complexity.
OpenTelemetry simplifies instrumentation, but managing fleets of OpenTelemetry Collectors requires robust configuration management and monitoring of the telemetry pipeline itself. If a collector misbehaves or drops batches, critical debugging data can vanish before it reaches storage.
Grafana and its companion storage backends like Mimir and Loki require deep operational expertise in database management, object storage configuration, and multi-tenancy rules. Smaller engineering teams often find that the operational toil of running an entirely self-hosted open-source observability stack outweighs the software license savings, leading many to adopt managed cloud versions of these same open tools.
Choosing Your Path Forward in the Observability Landscape
Navigating the choices between Prometheus, Grafana, and OpenTelemetry requires a clear assessment of your organization’s maturity, scale, and specific observability gaps. If your applications lack consistent instrumentation and your developers are bogged down by vendor-specific SDKs, adopting OpenTelemetry should be your immediate priority. It future-proofs your telemetry pipeline and ensures your data remains portable.
If your primary challenge is monitoring infrastructure health, tracking resource utilization, and setting up reliable alerts for containerized environments, Prometheus remains an unmatched, battle-tested engine for metrics. Paired with PromQL, it provides the exact diagnostic speed needed during live incidents.
If your teams are struggling with fragmented views across logs, metrics, and traces, implementing Grafana as your central visualization hub will immediately break down operational silos and accelerate troubleshooting workflows. Ultimately, the question is not about declaring a single winner among these three giants. The true victory lies in understanding their unique superpowers and weaving them together into a cohesive observability strategy that empowers your engineering organization to build more resilient systems.